British scholar Thomas Bayes proposed a fundamental theorem in probability theory, which is expressed by the following formula:
$$P(A|B)=\frac{P(B|A)P(A)}{P(B)}$$
Where A and B are two random events, and the probability of event B occurring, $P(B)$, is not zero.
In this formula:
- $P(A)$ is the probability that event A will occur.
- $P(B)$ is the probability that event B will occur.
- $P(A|B)$ is the conditional probability that event A will occur given that B has already occurred (and vice versa for $P(B|A)$).
Let’s illustrate this with an example:
$P(\text{Xiao Ming is late}) = 0.3$ means there is a 30% chance that Xiao Ming will be late.
$P(\text{The boss checks attendance}) = 0.2$ means there is a 20% chance that the boss will check attendance.
$P(\text{Xiao Ming is late} | \text{The boss checks attendance}) = 0.25$ means if the boss checks attendance, there is a 25% chance that Xiao Ming happens to be late at that moment.
Using these three known conditions, I can use Bayes’ theorem to deduce $P(\text{The boss checks attendance} | \text{Xiao Ming is late})$—which is the probability that the boss happens to be checking attendance, given that Xiao Ming is late today.
$$P(\text{The boss checks attendance} | \text{Xiao Ming is late}) = \frac{0.25 \times 0.2}{0.3} = 0.1667$$
(Self-correction: The original calculation in the example had a typo, $\frac{0.25×0.3}{0.2}$, which doesn’t match the standard Bayes’ formula structure $P(B|A) = \frac{P(A|B)P(B)}{P(A)}$. I have corrected it here to $P(\text{Boss Checks} | \text{Late}) = \frac{P(\text{Late} | \text{Boss Checks}) P(\text{Boss Checks})}{P(\text{Late})} = \frac{0.25 \times 0.2}{0.3} = 0.1667$.)
I think I can use this formula to derive the actual number of COVID-19 infections. The calculation process below might be tedious, but the result is very interesting.
We know the US population is approximately 327,200,000. As of March 19, the US had tested a total of 103,945 people, of whom 14,250 tested positive. The information we know is:
1 | N = 327200000 # population in the United States |
First, from this data, we can extract the probability of a random person having been tested:
$$P(\text{TESTED})= \frac{\text{TESTED}}{N} = 0.031768%$$
Next, we can find the probability of a person being infected, given they have already been tested (the test positivity rate):
$$P(\text{INFECTED}|\text{TESTED}) = \frac{\text{POSITIVE}}{\text{TESTED}} = 13.7091731%$$
We have an unknown variable: $P(\text{TESTED}|\text{INFECTED})$. This is the probability that someone who is already infected will actually get tested. Let’s represent this probability with the variable $\pi$.
If I want to find the true infection rate, $P(\text{INFECTED})$, we can apply Bayes’ theorem:
$$P(\text{INFECTED}|\text{TESTED}) = \frac{P(\text{TESTED}|\text{INFECTED}) \times P(\text{INFECTED})}{P(\text{TESTED})}$$
Plugging in the known values:
$$13.7091731% = \frac{\pi \times P(\text{INFECTED})}{0.031768%}$$
Rearranging the terms:
$$P(\text{INFECTED}) = \frac{13.7091731% \times 0.031768%}{\pi}$$
Now, let’s address this $\pi$. You can refer to the data published by the CDC.
Specifically, look at this chart: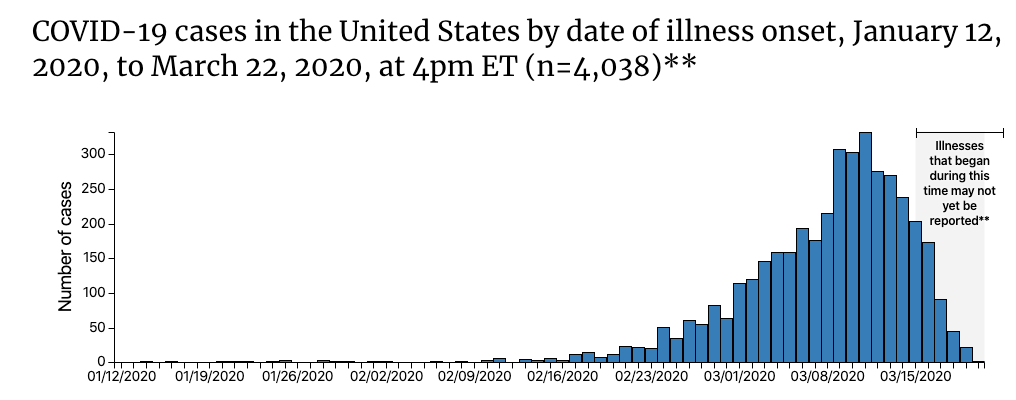
This chart displays the actual infected numbers (both tested and untested) as reported by the CDC. You might wonder how they know about the untested people. This data is updated retrospectively. For example, if a patient is received on March 20th and asked when they started having a fever, and they say 4 days ago, the CDC would add 1 to the data for March 12th (adding 14 days of incubation period prior to the fever start date). The data I used when writing this blog is from March 19th; that portion of the retrospective data had not been fully compiled yet. Once it is compiled, we can know what $\pi$ is.
Assuming people were very proactive and 80% of infected individuals went to get tested immediately ($\pi = 0.8$), we could obtain:
$$P(\text{INFECTED}) = \frac{13.7091731% \times 0.031768%}{0.8} = 0.00544391%$$
In this case, the true infection rate would be 0.00544391%. Multiplying this by the US population of 327,200,000, roughly 17,813 people were infected at that time. If you are interested in Bayes’ Theorem, you can watch the following videos:
A Concise Proof of Bayes’ Theorem
Bayes’ Theorem: Making Probability Intuitive
Khan Academy also released an interesting video explaining the outbreak in Wuhan: Watch it here
The research on COVID-19 by these experts is also very insightful:
Trying to Estimate Disease Prevalence from Fragmentary Test Results